Quick overview: what this article will show
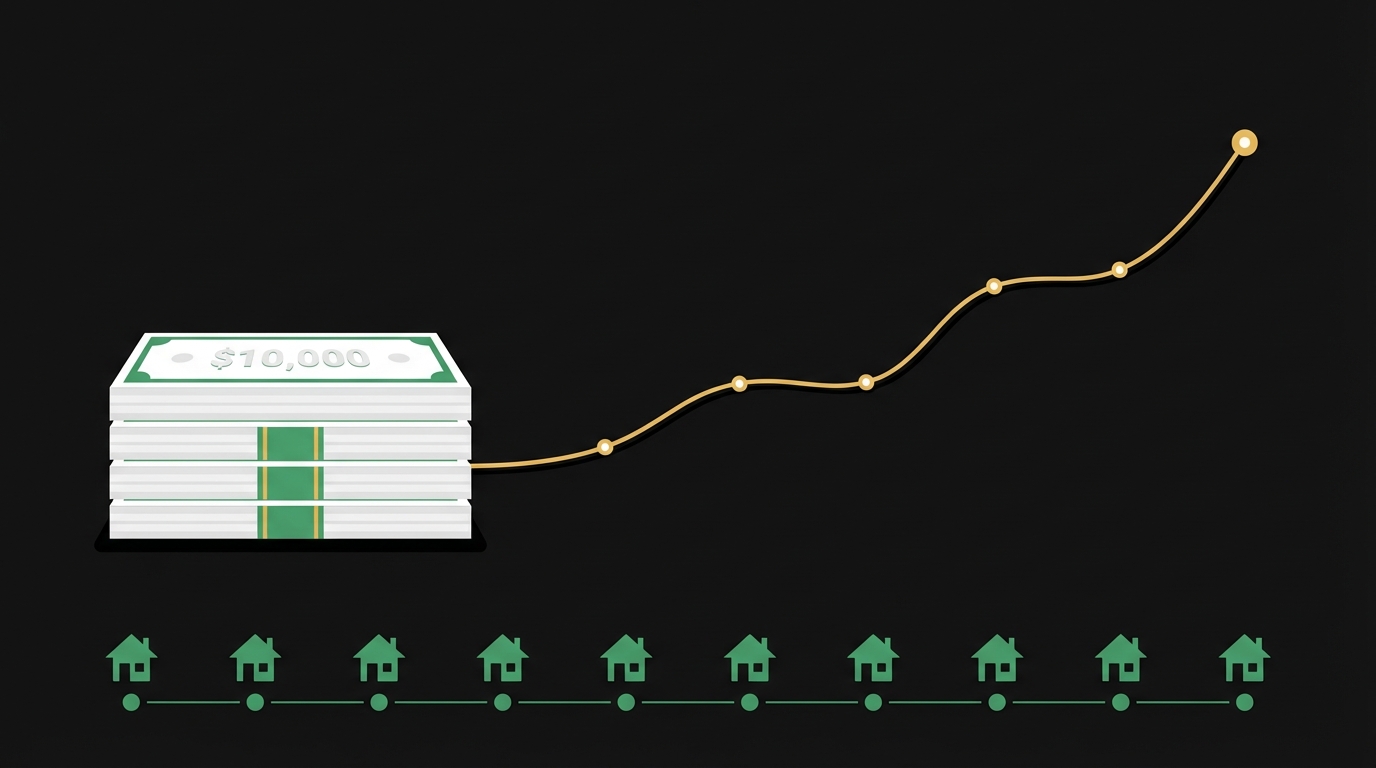
This article answers the simple question: what does $10,000 become in 10 years when you apply compound interest, and how should you compare that to getting started in real estate? We will show a nominal example, convert that result to todays dollars using CPI-based adjustment, and outline the common ways people enter real estate so you can compare apples to apples.
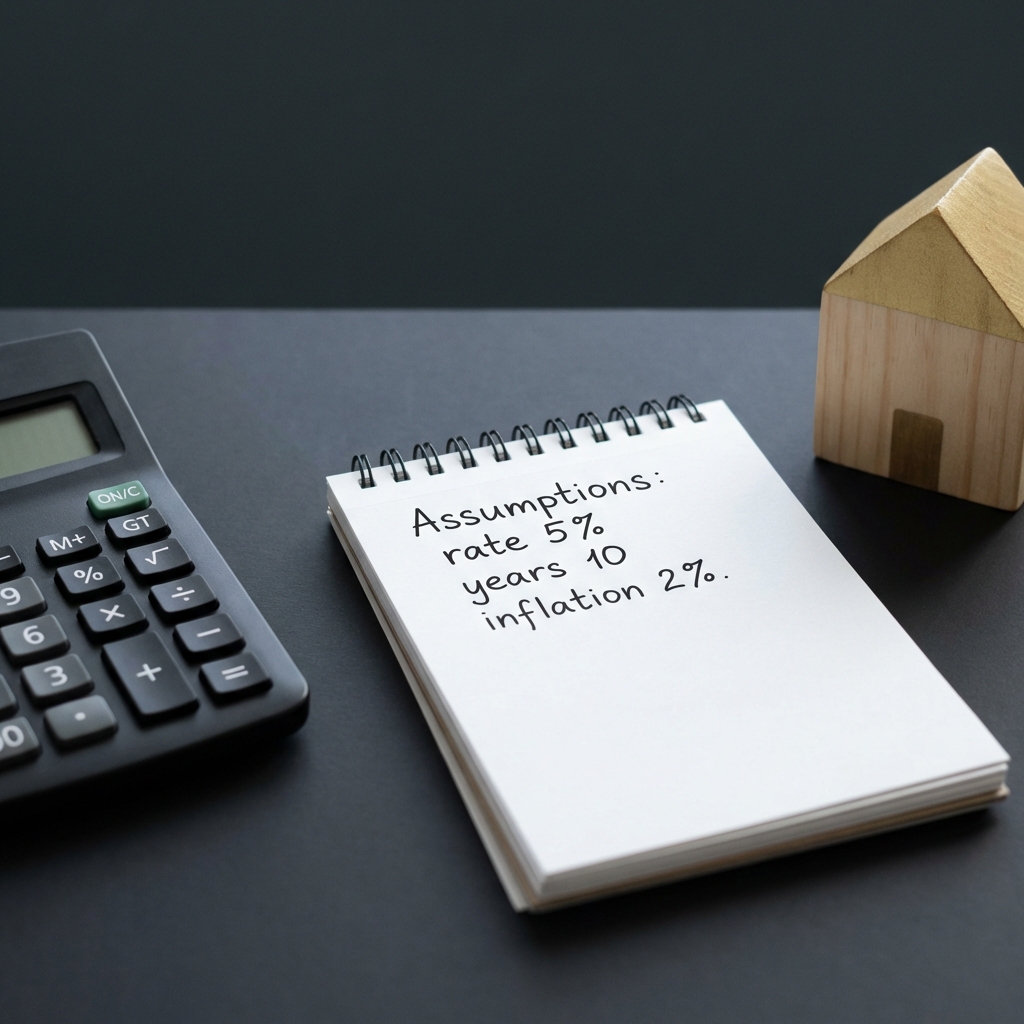
We use the standard compound interest framework and simple, transparent assumptions so you can change the inputs yourself. The primary limits to any 10-year projection are the assumed annual return, how often returns compound, expected inflation, and any fees, vacancy or financing costs tied to real estate.

For readers specifically wondering how to get into real estate investing, this article describes direct ownership, REITs, and crowdfunding, and summarizes what each path includes in a ten-year return calculation. The section with that guidance uses clear examples and flags local and tax differences that matter.
Key assumptions to watch for across the article are annual nominal return, compounding frequency, inflation rate for real adjustments, ongoing fees and taxes, vacancy or downtime for rentals, and whether you use leverage. Small differences in any of those change a 10-year outcome materially.
Run your own 10-year scenarios
Try the worked examples below with your own rates and fees, or use the checklist later in the article to compare market investing and simple real estate entry options.
Quick answer: a simple nominal example using the compound interest formula
The standard compound interest formula for future value is FV = PV × (1 + r)^n, where PV is the present value, r the annual rate, and n the number of years. This formula and how investors use it for projections are described in investor education resources that also power many online calculators Investopedia future value definition, or see our investing section.
Using that formula with PV = $10,000, r = 5% (0.05), and n = 10, the nominal future value is 10,000 × 1.05^10, which equals about $16,289. This worked example shows how modest annual growth compounds over a decade and is the same method many 10-year calculators use Investor.gov compound interest calculator.
That $16,289 is a nominal amount. It reflects dollars in 10 years, not what those dollars will buy today. The number also depends heavily on the chosen annual rate and whether interest compounds annually or more frequently, so treat it as one possible scenario rather than a forecast.
compute future value from present value, rate, and years
use whole years for simplicity
How to calculate future value yourself: formula, compounding, and tools
The basic annual-compounding formula is FV = PV × (1 + r)^n. If interest compounds m times per year, the adjusted formula is FV = PV × (1 + r/m)^(n×m). Both variants are standard in investor education materials and used by online calculators you can trust for simple projections Investopedia future value definition.
Step 1: decide your inputs. Choose a realistic annual nominal return r, the compounding frequency, and n = 10 for a decade. Step 2: plug PV, r, and n into the formula, or copy the same inputs into a trusted compound interest calculator. Step 3: if you expect regular contributions, add those as periodic deposits in the calculator rather than using the single-lump formula, because contributions change the math.
The nominal future value depends on the assumed annual return and compounding. For example, at 5% annual compounded once, $10,000 grows to about $16,289; adjust that figure for inflation to compare real purchasing power.
When using an online tool, verify three inputs carefully: the numerical annual rate (for example 5 versus 0.05), whether the calculator treats the rate as a percentage, and the compounding frequency. Mistakes in any of those will produce wrong results even when the calculator itself is correct Investor.gov compound interest calculator. You can also try an inflation tool such as Calculator.net's inflation calculator when checking conversion behavior.
Also check whether a tool outputs nominal future value only, or whether it can also adjust for inflation. If the calculator does not include inflation, you can convert nominal FV to today’s dollars with the real-return method described below.
Adjusting for inflation: turning nominal results into real purchasing power
Nominal future value does not show purchasing power. To express results in today’s dollars, convert the assumed nominal return to a real return using CPI-based adjustment: real return ≈ (1 + nominal) / (1 + inflation) − 1. The Bureau of Labor Statistics provides CPI-based tools and documentation for this approach BLS CPI inflation calculator.
Workflow example: compute nominal FV with your chosen rate and compounding. Then compute the real annual return by applying the CPI formula. Finally, apply the real return to the present value or adjust the nominal FV back to today’s dollars by dividing by (1 + inflation)^n. Each step requires a clear inflation assumption; for 10-year comparisons, small changes in assumed inflation matter. You can also compare results with other online inflation tools such as the SmartAsset inflation calculator.
Why this matters: an investment that grows nominally may still lose purchasing power if inflation outpaces the nominal return. Using the CPI-based conversion lets you compare the real value of holding cash, stocks, bonds, or a rental property over the same time horizon.
How to get into real estate investing: key options and what returns include
Real-estate total returns combine rental yield (the cash income you receive) plus price appreciation, minus operating and transaction costs. These components are the basic building blocks for any ten-year return estimate and are commonly highlighted in industry research about property returns Zillow research data.
Direct ownership requires active management or paid property management, plus considerations like vacancy, repairs, insurance, and local taxes. Each cost reduces the net rental yield you might expect, so a clear line-item budget for these items is essential before you compare a property to a market investment. See our real-estate side hustles guide for low-friction local approaches.

Lower-friction options such as publicly traded REITs or regulated real-estate crowdfunding provide exposure to property cash flows and appreciation without direct tenant management, although they come with different fee, liquidity, and tax profiles that affect net returns Nareit REIT market data. For examples of crowdfunding platforms and reviews see our MainVest review.
Practical paths: comparing direct property ownership vs REITs and crowdfunding
Direct ownership checklist: initial down payment or full purchase price, mortgage interest cost if leveraged, property taxes, insurance, ongoing maintenance, property management fees if you hire an agent, and expected vacancy periods. Each element lowers the gross rental yield and should be included in a ten-year cash-flow model.
Typical cost items to test include an annual property management fee (often a percentage of rent), a conservative vacancy allowance, a maintenance reserve, and one-time transaction costs when buying and selling. Factoring these in gives a more realistic net yield than relying on headline rent-to-price ratios alone Nareit REIT market data.
REITs trade on public markets, offer daily liquidity, and distribute dividends that approximate rental yields, but they also charge operating fees and are subject to market volatility and different tax treatment than personally held property. For an investor who wants exposure without managing tenants, REITs and some crowdfunding structures can be suitable but should be compared on fees and liquidity FINRA guide to REITs.
Decision checklist: assumptions and criteria that change a 10-year outcome
Start by listing the assumptions you will test: annual nominal return, inflation, compounding frequency, fees and taxes, vacancy rate, maintenance and management costs, and whether you plan to use leverage. These are the variables that most strongly move a 10-year projection.
Run three scenarios for each option: conservative, base, and optimistic. For a market investment, vary the annual rate and fees. For direct real estate, vary rental yield, vacancy, and maintenance. For leveraged scenarios, include expected mortgage interest and the effect of leverage on returns and downside risk. Scenario testing helps reveal sensitivity to small input changes.
Personal factors matter. Time horizon, need for liquidity, tolerance for tenant issues or property upkeep, and local market familiarity should influence whether you prioritize direct ownership, REITs, or simple market investing when comparing where to deploy $10,000.
Common mistakes and pitfalls to avoid when projecting 10-year returns
A common error is using a single fixed rate as the only scenario. Because compound growth magnifies small differences, testing multiple rates and fee schedules is essential to avoid misleading conclusions. Always label your scenarios and keep the inputs visible for review.
Another frequent omission is failing to adjust nominal results for inflation or forgetting transaction and recurring costs for real estate. For rentals, ignoring vacancy and maintenance typically overstates net returns; for market investments, ignoring fees and taxes does the same.
Finally, dont assume leverage only magnifies gains. It also magnifies losses and adds periodic cash requirements for interest and principal. If you include leverage in a projection, show both upside and downside scenarios so you understand potential cash flow risks.
Worked examples and scenarios: stock-like returns, conservative bond-like returns, and a simple real-estate scenario
Example A: $10,000 at 5% nominal, compounding annually, for 10 years. Using FV = PV × (1 + r)^n, FV = 10,000 × 1.05^10 ≈ $16,289. This is the nominal outcome from the standard formula and matches many compound-interest calculators when inputs are entered precisely Investopedia future value definition.
To convert that nominal FV to todays dollars, compute the real return for a chosen inflation rate and then apply it to PV or divide the nominal FV by (1 + inflation)^10. The CPI-based method for this conversion is documented by the Bureau of Labor Statistics and is the conventional way to express purchasing power over time BLS CPI inflation calculator.

Example B: $10,000 at 2% nominal, compounding annually, for 10 years. FV = 10,000 × 1.02^10 ≈ $12,190 nominal. This conservative scenario shows how much sensitivity exists to the annual rate across a decade: a few percentage points change final nominal balances noticeably Investor.gov compound interest calculator.
Example C: a simple direct rental scenario built from explicit assumptions rather than a single rate. Suppose you treat the $10,000 as a small initial cash investment into a rental-related position, and for transparency you state assumptions: treat the $10,000 as seed equity, estimate an annual gross rental yield, subtract expected annual vacancy and management and maintenance costs, and assume a modest annual property price change for appreciation. Industry research shows that rental yield plus appreciation minus costs is the correct composition for total real-estate returns Zillow research data.
For clarity, do not conflate the rental yield alone with total return. If you estimate a gross rental yield of 5% but expect 2% in combined vacancy and maintenance costs and 1% in management fees, the net cash yield is roughly 2%, and you must still add or subtract price appreciation to reach total return. State each element in your 10-year model so the math is transparent.
Putting it together: short checklist and realistic next steps
Quick checklist to compare $10,000 invested in market assets versus a simple path into real estate: 1) choose annual nominal return assumptions for market assets, 2) choose rental yield, vacancy, and cost assumptions for direct property, 3) decide if you will use leverage and include interest costs, 4) pick an inflation assumption to compute real purchasing power, 5) run conservative/base/optimistic scenarios and compare real FVs.
Where to find reliable inputs: use the BLS CPI tools for inflation assumptions, public indices such as Zillow research for local price trends, and investor-education calculators from trusted sources for compound computations. These primary inputs make scenario comparisons meaningful and reproducible BLS CPI inflation calculator or try the Minneapolis Fed inflation calculator.
Limitations and next steps: this article provides transparent methods and example scenarios but cannot substitute for local market data or personalized tax advice. If you are serious about buying property or using leverage, consider gathering local rent comparables, estimating taxes and insurance, and consulting a tax or real estate professional before committing funds.
Use the compound interest formula FV = PV × (1 + r)^n with your chosen annual rate and compounding. Online compound interest calculators can accept the same inputs and show nominal results quickly.
Yes. Convert nominal returns to real returns using the CPI-based formula real ≈ (1+nominal)/(1+inflation)−1 or divide nominal future value by (1+inflation)^n to express purchasing power in todays dollars.
Not always. Direct ownership needs more capital, involves active management and transaction costs, and is less liquid. REITs and crowdfunding can provide exposure with different fees, liquidity, and tax consequences.
References
- https://www.investopedia.com/terms/f/futurevalue.asp
- https://www.investor.gov/financial-tools-calculators/calculators/compound-interest-calculator
- https://www.bls.gov/data/inflation_calculator.htm
- https://www.zillow.com/research/data/
- https://financepolice.com/advertise/
- https://www.reit.com/data-research/reit-market-data
- https://www.finra.org/investors/alerts/reits-and-real-estate-investing
- https://financepolice.com/category/investing/
- https://financepolice.com/mainvest-review/
- https://financepolice.com/real-estate-side-hustles/
- https://www.calculator.net/inflation-calculator.html
- https://smartasset.com/investing/inflation-calculator
- https://www.minneapolisfed.org/about-us/monetary-policy/inflation-calculator